14 Plots
Abundance plots
To plot the abundance estimate with error bars representing the 95% confidence interval, use the function lta_plot():

Detection function plots
To plot the best-fit detection model for a species pool, use the df_plot() function.
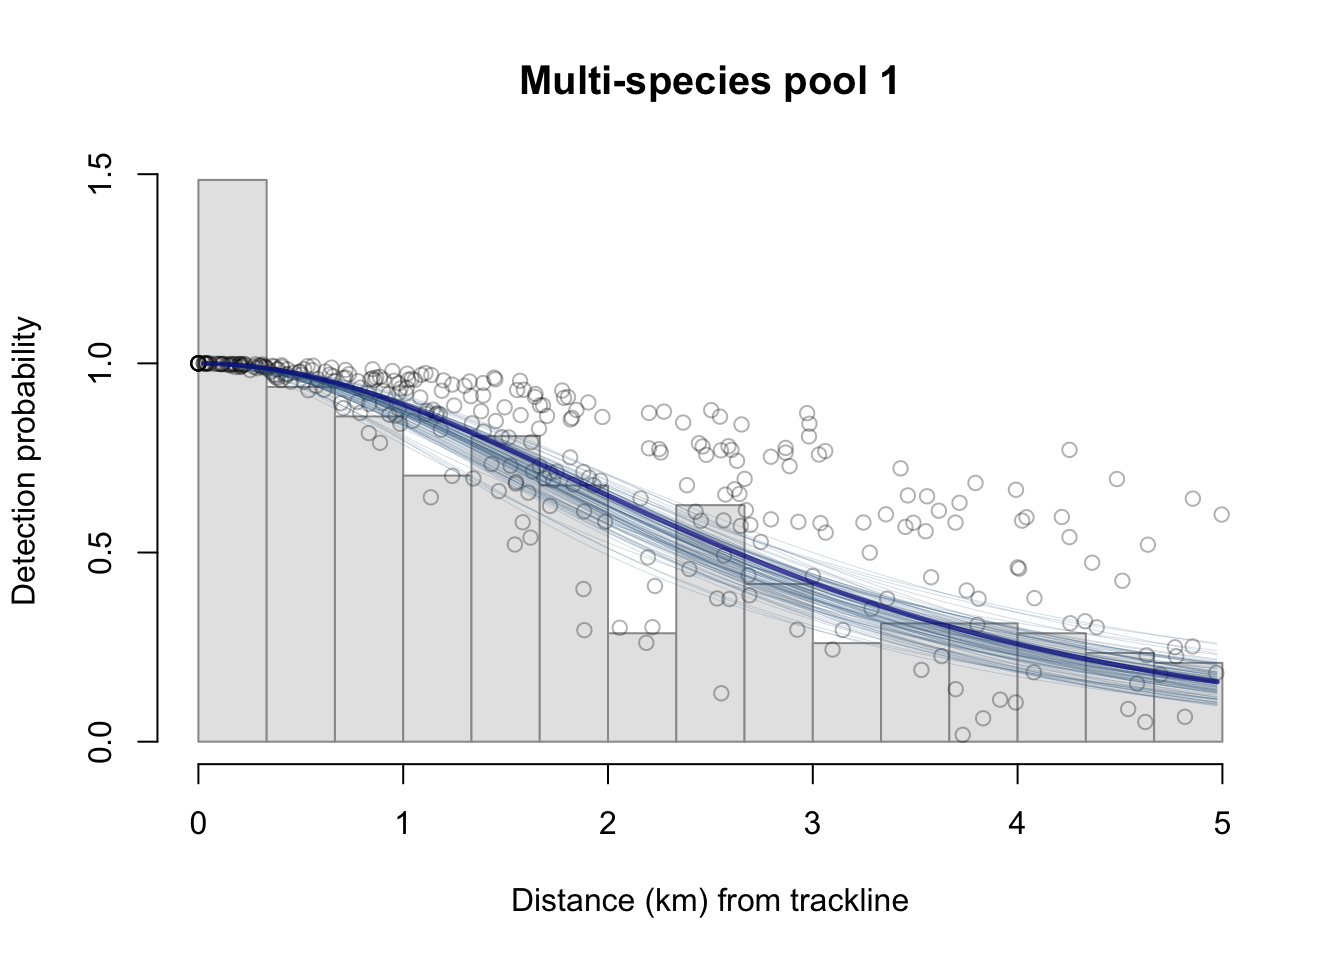
This function provides various stylization options, including the option to show multiple best-fitting models atop a single histogram of detections:
df_plot(lta_result,
        model_colors=RColorBrewer::brewer.pal(n = 4, name = "Dark2"),
        model_pch = 16,
        pt_show=2,
        pt_alpha=.3,
        bootstrap_show = FALSE,
        legend_show=TRUE,
        legend_x=2.8)